
Watching the Baltic's undersea cables with Grafana geofence alerts
Every ship Finland's AIS network hears, 45 cables and pipelines with a fence around each, and a Grafana alert for every cargo ship or tanker that stops over one, drawn on the ship.
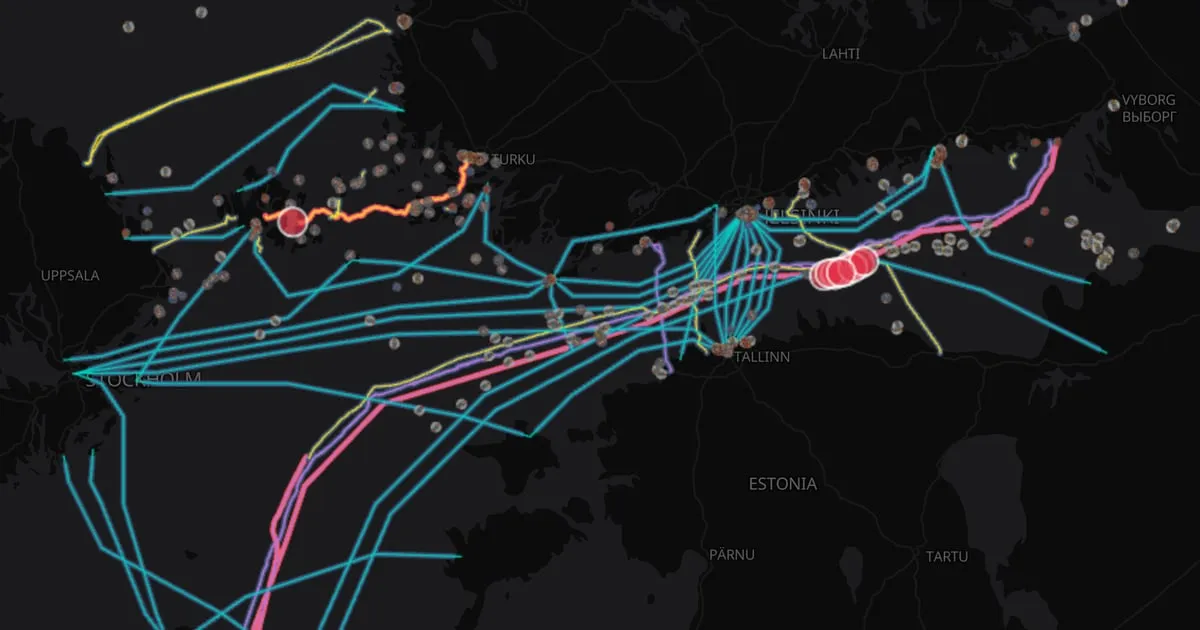
Since 2023, anchors dragged along the floor of the Baltic have cut cables and a gas pipeline: Balticconnector, C-Lion1 and Estlink 2 among them. Each time, suspicion fell on a ship that had crossed the line with its anchor down.
That signature is visible in open data. Ships broadcast their position, speed and status over AIS, and the routes of the cables are published. So we built a Grafana dashboard that watches for it, live, and raises an alert for every cargo ship or tanker that stops over a cable. It runs on Pacha, our open spatio-temporal stack, and anyone can open it.
What the dashboard shows
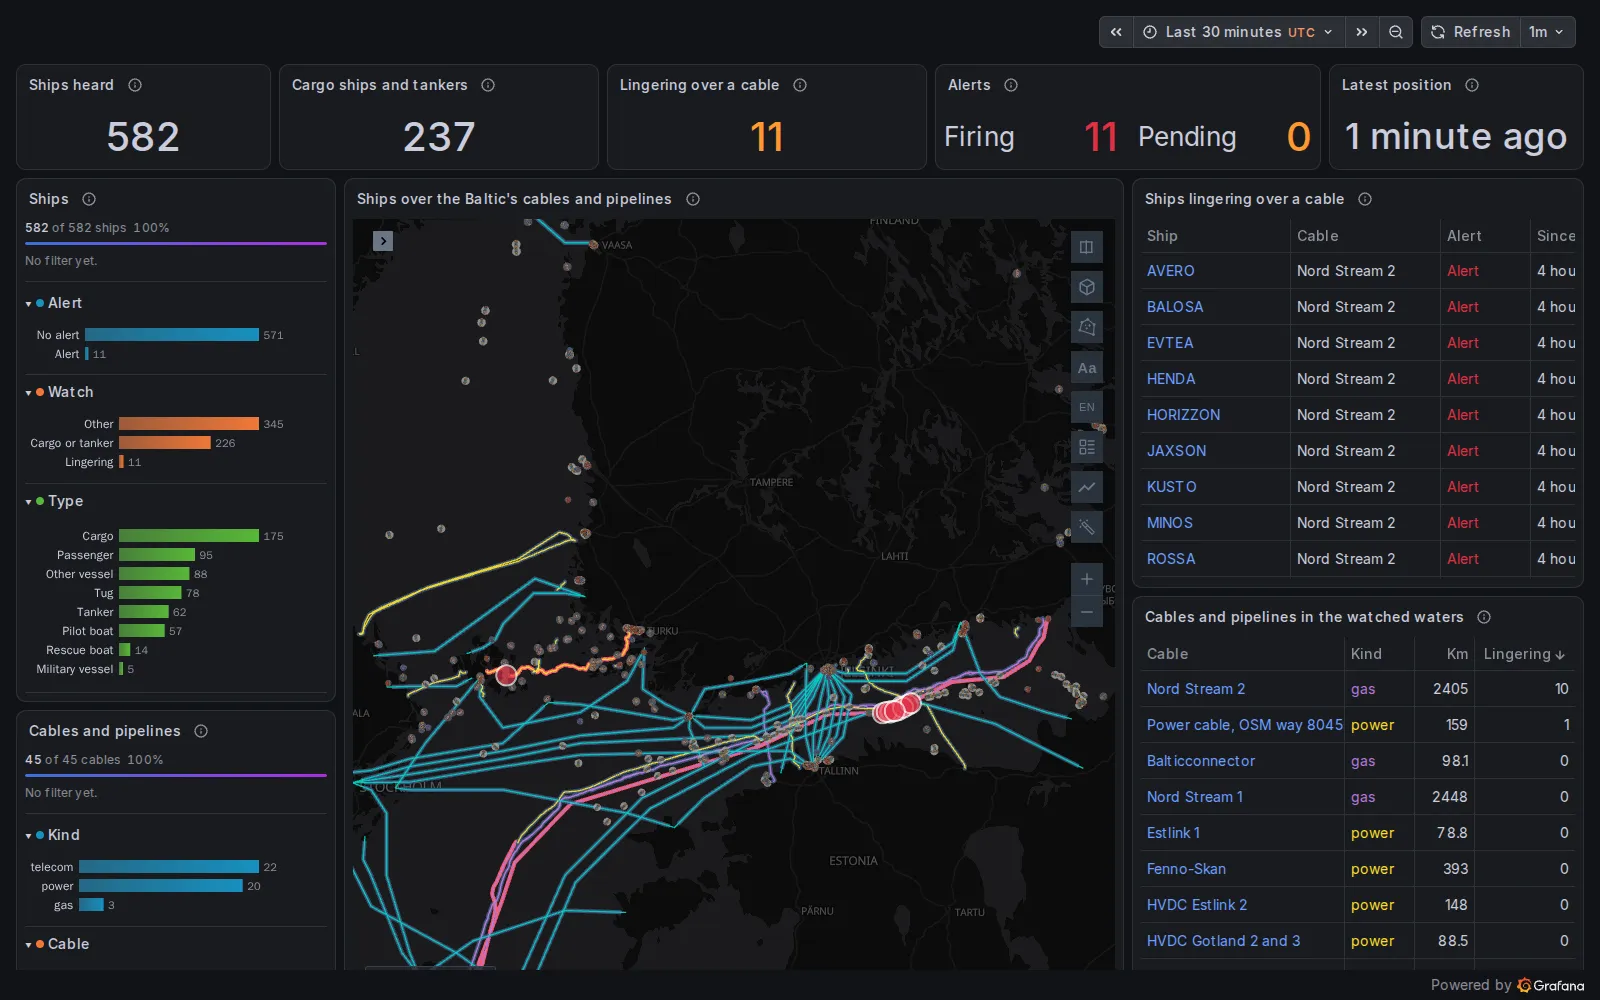
The dashboard early on 12 November 2026: 582 ships heard, 11 alerts firing.
- Every ship Finland’s AIS stations hear, from the Gulf of Finland to the Bothnian Sea: around 600 at a time, read from Digitraffic, the open data service of Finland’s traffic agency.
- 45 cables and pipelines in those waters: 22 telecom cables, 20 power cables and 3 gas pipelines.
- A fence around each one: a kilometre either side, less 5 km around ports and cable landings, where ships are expected to wait.
- An alert for every cargo ship or tanker inside a fence that is slow (under 3 knots) or at anchor. It is pending while the ship arrives and fires once it has stayed 15 minutes. At anchor and still moving 2 to 6 knots, the sign of an anchor being dragged, the alert is critical.
On the map, each alert is drawn on its ship and each fence takes the colour of the alerts inside it: red while one fires, amber while one is pending, blue when nothing is there.
When we took the screenshots, 11 alerts were firing. Ten were nine tankers and a cargo ship at anchor over Nord Stream 2, in the Gulf of Finland east of Helsinki, seven of them giving “for orders” as their destination. The eleventh was a small cargo ship moored in the Åland Islands, over a power cable.
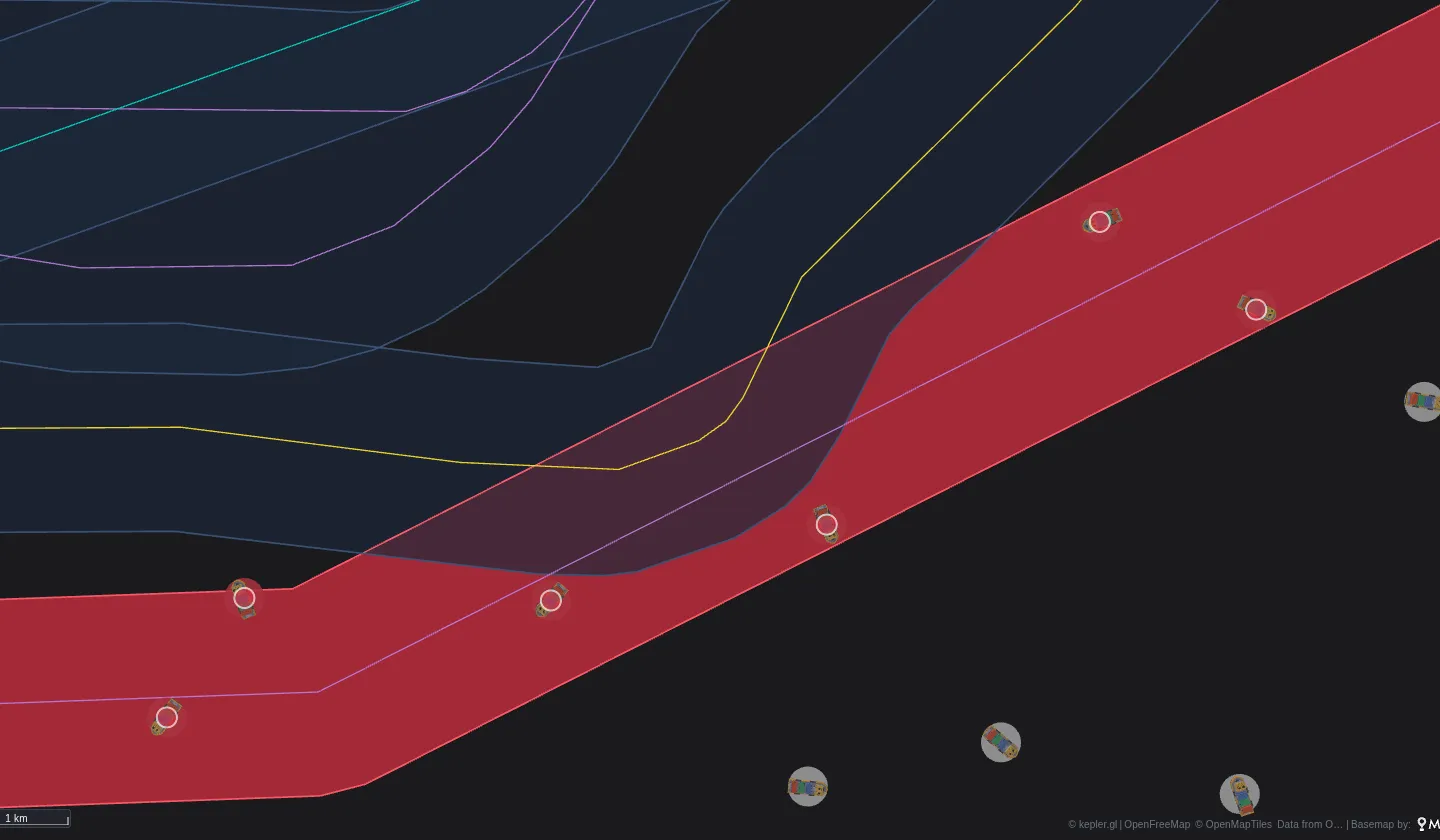
Zoomed in east of Helsinki. The fence of Nord Stream 2 is red because the alerts that name it are firing, and each alert is a ring on its ship. The fences of the other cables, with no ship lingering in them, stay blue.
A slow ship over a cable is not an accusation. Anchorages off busy ports lie over pipelines, and ships wait there for a berth or for orders. The watch does not say who is guilty; it says where to look, and it keeps looking at night.
How it is built
The dashboard has four parts. They are all in the Pacha repository, and none of them is specific to ships.
1. The ships
Digitraffic serves AIS positions and ship details as JSON, without a key, and asks clients to identify themselves in
a header. Pacha’s gateway (nginx) adds the header and caches the answer for 30 seconds. DuckDB, a data source that
runs on Grafana’s server, reads it with read_json like any other table.
2. The fences
The cables come from TeleGeography, OpenStreetMap and EMODnet. A build script merges them, buffers each line by a
kilometre and cuts out the ports and landings. The result is one Parquet file with 45 fences, which DuckDB queries
with its spatial extension.
3. The rule
The alert is an ordinary Grafana alert rule, provisioned from a file. Grafana evaluates it every minute on the server, whether or not anyone has the dashboard open. Its query finds the ships inside a fence:
-- One row per ship and cable: a cargo ship or tanker inside a fence,
-- slow, or at anchor and moving under 6 knots.
SELECT s.mmsi, s.ship, s.flag, s.type, c.cable, c.kind,
  CASE WHEN s.nav_status = 1 AND s.knots >= 2 THEN 'Dragging anchor'
       WHEN s.nav_status = 1 THEN 'At anchor'
       ELSE 'Slow' END AS signature
FROM ships s
JOIN fences c ON ST_Contains(c.fence, ST_Point(s.longitude, s.latitude))
WHERE s.watched AND (s.knots < 3 OR (s.nav_status = 1 AND s.knots < 6))
A SQL expression then returns those columns and a 1. Grafana makes one alert instance per row, labelled with the
ship and the cable, and a pending period of 15 minutes turns a ship that stays into a firing alert. On your own
Grafana, the rule would notify through your contact points (email, Slack, PagerDuty). On our public demo, it only
changes state.
4. The map
The map is a Kepler Geospatial Maps Plus panel. Its own query draws the ships and the cables; the alerts need no query at all. Plus reads the rule’s active alerts and puts each one on the thing it names:
"alerts": {
  "show": true,
  "filter": "watch=baltic-cables",
  "entityLabel": "mmsi",
  "entityField": "mmsi",
  "zones": true,
  "zoneLabel": "cable",
  "zoneField": "cable"
}
entityLabel says which label of the alert names the ship, and entityField which column of the map’s data holds
the same id: each alert is drawn at that ship’s latest position, and follows it between reads of the rule.
zoneLabel does the same for the fences, so each fence is coloured by its own alerts rather than by the whole rule.
The ships are a Fleet layer, with a 3D model for each type and a card that opens on click. The filters on the left run in the browser on Chaski (DuckDB-WASM), and the map, the counters and the tables all follow them. Click a ship in the table and the map follows it with its card open.
Your own fences
Nothing here is specific to the sea. The same three pieces make any geofence watch:
- things that move, with an id and a position: trucks, buses, drones, tagged animals, people indoors;
- fences: depots, restricted zones, routes, paddocks, floors of a building;
- a rule that returns one row per thing inside a fence.
The rule can run on whatever already holds the positions. PostGIS, BigQuery, Snowflake and SQL Server test the fence in the query. Data sources without spatial functions return the positions, and a SQL expression tests them against the fence’s edges. The geofence alerts guide has both, with the map options above.
Open the live dashboard and see what is lingering right now.
Data. Ships: Digitraffic, Fintraffic (CC BY 4.0). Telecom cables: TeleGeography's Submarine Cable Map (CC BY-SA 4.0). Power cables: © OpenStreetMap contributors (ODbL). Gas pipelines and ports: EMODnet Human Activities (CC BY 4.0). Base map: OpenFreeMap, OpenMapTiles, OpenStreetMap.